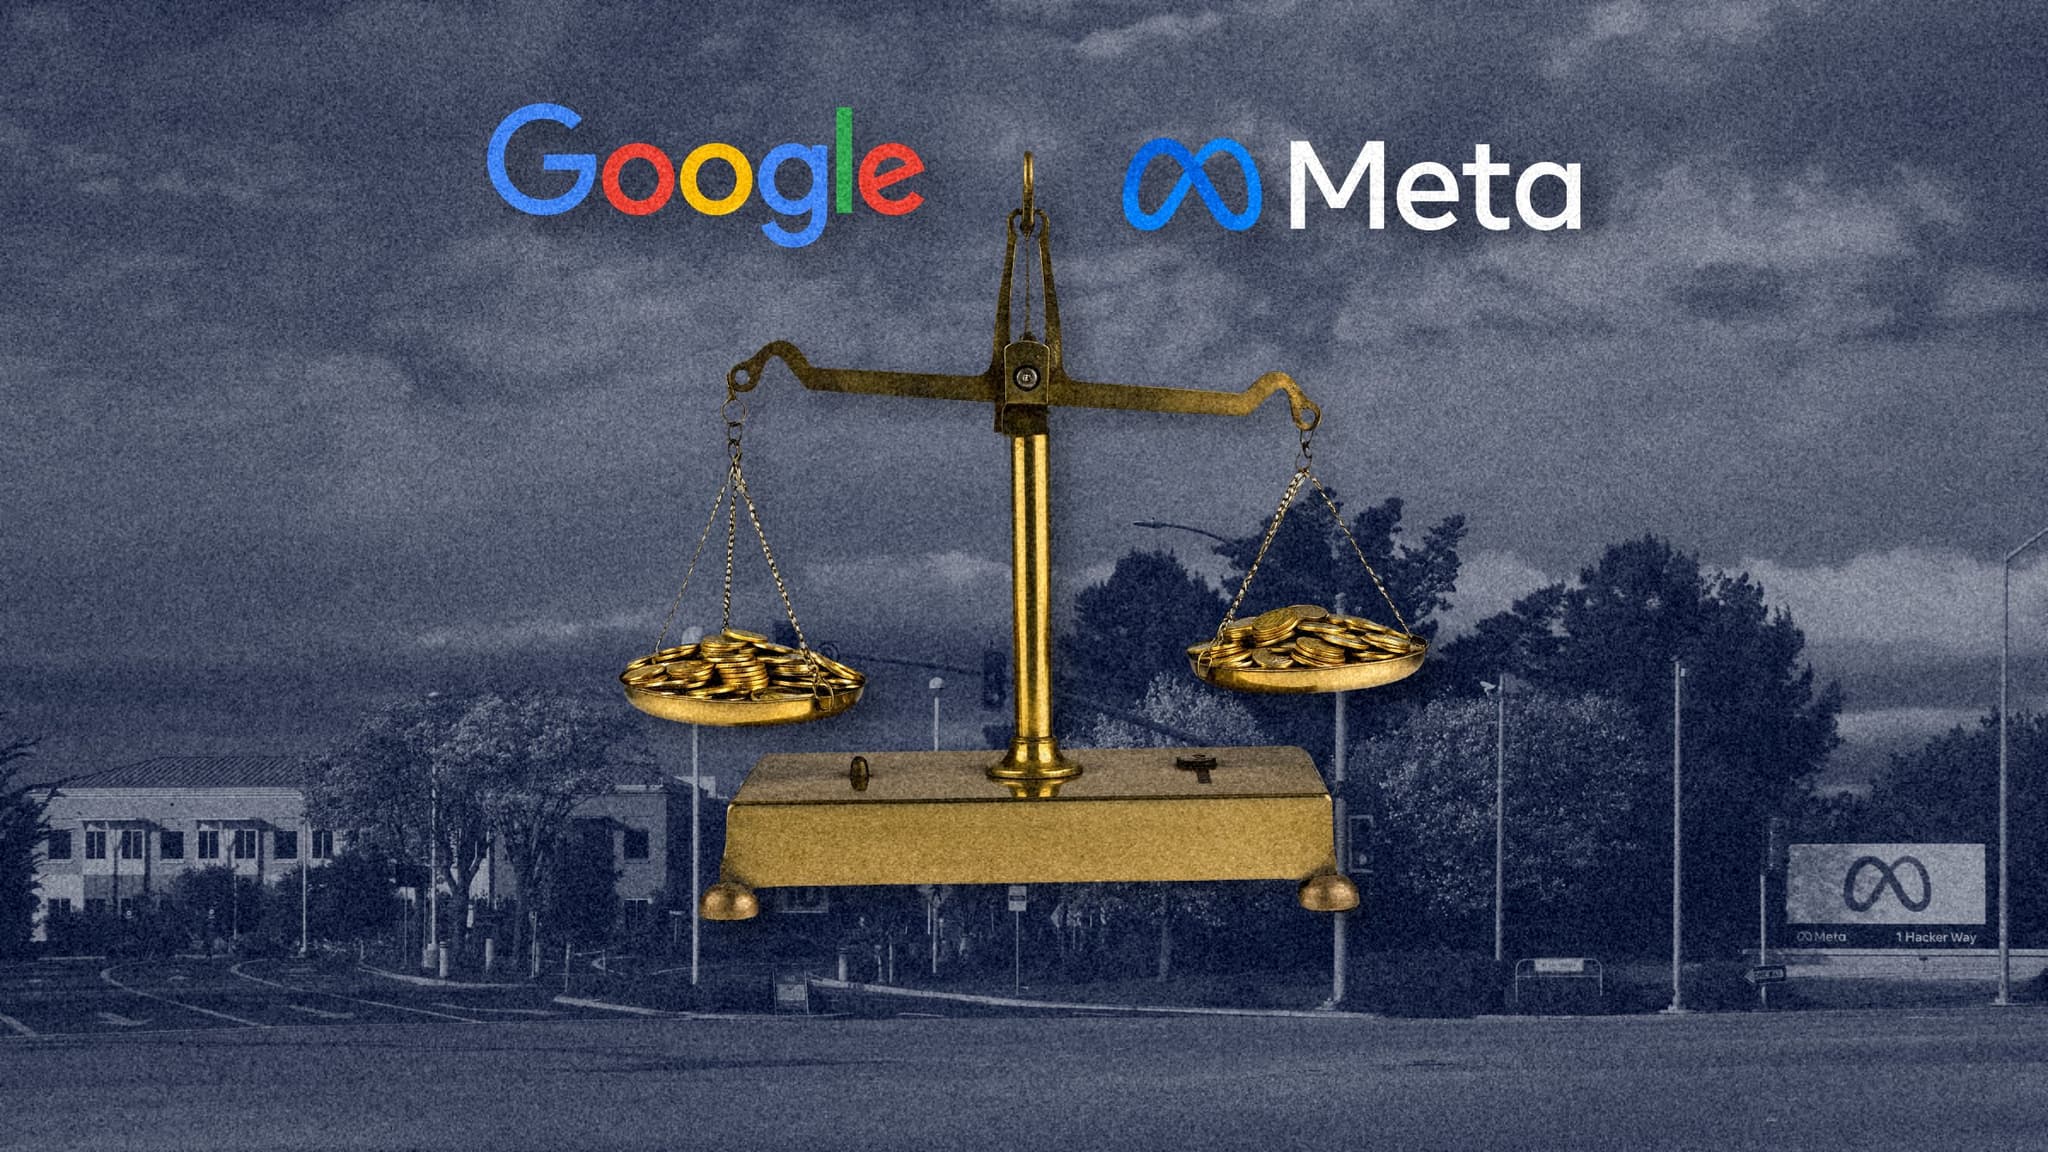
Meta's advertising revenue was $63.1 billion in the third quarter of 2026, up 26% from a year earlier and $289 million short of the $63.4 billion that Google Search & other brought in, according to the two companies' earnings releases. Two years earlier the gap was $9.5 billion. Meta's ads grew more than twice as fast as Google's search unit, which grew 12%.
The comparison spread across the business press on November 1, including CNBC's report, alongside a second figure: Google's ad impressions fell 14%. That number is real, but it is narrower than it sounds. Alphabet's 10-Q shows it covers Google Network, the ads Google places on other companies' sites and apps. On Google's own search pages, paid clicks rose 8%. Our earlier pieces covered Alphabet's quarter and Pipedrive's job cuts, which its CEO tied to AI cutting its free traffic. This piece puts nine quarters of both companies' filings side by side.
Key findings
The gap between Google Search & other and Meta's advertising revenue narrowed from $9.5 billion in Q3 2024 to $6.5 billion in Q3 2025 and $289 million in Q3 2026.
Meta added $13.0 billion of quarterly ad revenue from a year earlier; Google Search & other added $6.8 billion.
Over the four quarters to September, Google Search & other still led, $250.1 billion to $235.6 billion, but that lead more than halved from $30.7 billion a year before.
Google's search paid clicks rose 8% and cost per click 4% in Q3 2026; the 14% fall in impressions was on Google Network, where impressions have fallen from a year earlier in every quarterly filing since Q3 2023.
Meta grew both levers: ad impressions up 10% and average price per ad up 14%.
The gap, quarter by quarter
Each company's earnings release reports the quarter and the same quarter a year earlier, so five releases from each give nine quarters. Meta's line is its advertising revenue; Google's is Google Search & other, which Alphabet's 10-Q defines as search ads plus ads on "other Google owned and operated properties like Gmail, Google Maps, and Google Play". YouTube and Google Network are separate lines.
Quarter | Meta ads | Google Search | Gap |
|---|---|---|---|
Q3 2024 | $39.9B | $49.4B | $9.5B |
Q4 2024 | $46.8B | $54.0B | $7.3B |
Q1 2025 | $41.4B | $50.7B | $9.3B |
Q2 2025 | $46.6B | $54.2B | $7.6B |
Q3 2025 | $50.1B | $56.6B | $6.5B |
Q4 2025 | $58.1B | $63.1B | $4.9B |
Q1 2026 | $55.0B | $60.4B | $5.4B |
Q2 2026 | $59.4B | $63.3B | $3.9B |
Q3 2026 | $63.1B | $63.4B | $0.3B |
Source: Meta and Alphabet earnings releases (Form 8-K, Exhibit 99.1), Q3 2025 to Q3 2026; SaasBuzz calculation. Gap is Google Search & other minus Meta advertising, computed from the millions the releases report.
The gap swings with the seasons, since both businesses peak in the fourth quarter, so the fair comparison is the same quarter a year apart. On that basis it shrank by $3.0 billion between Q3 2024 and Q3 2025, then by $6.2 billion in the year to Q3 2026. Meta's growth rate was 26% in Q3 2025 and 26% again in Q3 2026; Google Search & other slowed from 15% to 12%, after 19% in Q1 2026 and 17% in Q2. CNBC reported that the 14-point difference in growth was the widest in Meta's favor since 2021.
Google is still the bigger advertising company. Counting YouTube ads and Google Network, Google's advertising revenue was $82.0 billion in the quarter, against Meta's $63.1 billion, according to the Alphabet release.
Search clicks are rising; the 14% fall is elsewhere
Alphabet reports two traffic measures in its 10-Q. Paid clicks and cost per click "pertain to traffic on Google Search & other properties", and impressions and cost per impression to Google Network, which "includes impressions displayed to users on Google Network properties participating primarily in AdMob, AdSense, and Google Ad Manager", according to the Q3 2026 10-Q. Each change below is from the same period a year earlier.
Quarter | Search clicks | Cost per click | Network impr. |
|---|---|---|---|
Q3 2023 | +7% | +4% | -3% |
Q1 2024 | +5% | +8% | -13% |
Q2 2024 | +6% | +7% | -17% |
Q3 2024 | +4% | +8% | -14% |
Q1 2025 | +2% | +7% | -5% |
Q2 2025 | +4% | +8% | -6% |
Q3 2025 | +7% | +7% | -5% |
Q1 2026 | +13% | +5% | -9% |
Q2 2026 | +13% | +3% | -12% |
Q3 2026 | +8% | +4% | -14% |
Source: Alphabet 10-Q filings, monetization metrics tables, Q3 2023 to Q3 2026. Alphabet reports fourth quarters only as full years in its 10-K: Network impressions fell 5% in 2023, 11% in 2024 and 7% in 2025.
So the claim of a slide of nearly four years holds for Google Network: impressions there were down from a year earlier in every quarterly filing we checked, back to Q3 2023, and in each of the last three full years. The 14% fall is not the worst of the run, though. It matched Q3 2024 and was smaller than the 17% drop in Q2 2024. Google Network revenue rose $101 million to $7.5 billion in the quarter, because cost per impression rose 14%; the 10-Q says the increase came "primarily due to an increase in AdMob revenues" and was "partially offset by a decrease in AdSense revenues".
On Google's own pages the volume is growing. Paid clicks rose 8% in Q3 2026, a slowdown from 13% in each of the two previous quarters but above each of the first three quarters of 2024 and 2025. Alphabet's 10-Q puts Search growth down to "increases in search queries resulting from growth in user adoption and usage on mobile devices; growth in advertiser spending; and improvements we have made in ad formats and delivery". Sundar Pichai, CEO of Google and Alphabet, made the same case on X the day of the results, writing that query growth was the fastest in five years.
Post on X by @sundarpichai
Q3 is in the books! We’re now on a half-trillion annual revenue run rate, with Alphabet revenues growing at 25%. - Our AI investments are driving overall Search query growth, including commercial queries - our YoY query growth rate is the highest it’s been in the last five years. - Google Cloud revenue grew 103%, powered by extraordinary demand for our AI infrastructure and AI solutions. Our 1P model APIs now process nearly 32B tokens/min (up 40% QoQ). - Strong momentum in model progress with Argon and Carbon leading the frontier, and Genie 4 our most advanced new world model yet. Thanks to our partners and employees around the world. More to share on the call soon!
Meta sells more ads, at higher prices
Meta's growth came from both volume and price. Ad impressions across its apps rose 10% in Q3 2026 and the average price per ad rose 14%, according to its earnings release of October 21. Impressions grew between 10% and 19% in each of the last five quarters, while price per ad rose between 6% and 14%.
Quarter | Impressions | Price per ad |
|---|---|---|
Q3 2025 | +14% | +10% |
Q4 2025 | +18% | +6% |
Q1 2026 | +19% | +12% |
Q2 2026 | +14% | +12% |
Q3 2026 | +10% | +14% |
Source: Meta earnings releases, Q3 2025 to Q3 2026. Changes are from the same quarter a year earlier.
A rising price per ad means advertisers are paying more for each slot in Facebook and Instagram feeds, which usually means they are getting results they can measure. Susan Li, Meta's chief financial officer, said advertisers that adopted the recommendations of its Meta AI business assistant drove almost 5% more conversions than similar advertisers that did not, CNBC reported. Meta's operating income fell 37% to $13.0 billion in the quarter as costs and expenses rose 68%, but those costs include a $9.89 billion charge for its agreement with 52 state attorneys general to resolve litigation related to teen mental health and social media; excluding it, operating income would have been $22.88 billion, according to its release.
What the industry is saying
Nate Elliott, an analyst covering AI at Emarketer, told CNBC that if chatbots get better at helping people find things, "people's search habits might change for the first time in a generation. That's potentially catastrophic for Google's ad business."
Eric Seufert, an independent analyst who writes Mobile Dev Memo, argued on X that the shift inside Google's results is already settled and that the open question is what the new formats earn.
Post on X by @eric_seufert
I wrote the first entry in the Google’s Gambit series two years ago, in October 2024. My point at that time was Google was re-architecting its core revenue engine from an “engagement distribution” mechanism to an “engagement sink,” and that by doing so the company could increase engagement and potentially monetize that augmented time spent. The real question now isn’t “is this happening?,” because that question was answered two years ago. Yes, AI Overviews and AI Mode are subsuming engagement. The forward-facing question is whether those new content formats can — in six months, 12 months, 24 months — monetize at parity or better than the legacy product.
Glenn Gabe, an SEO consultant at G-Squared Interactive, read the quarter as a sign that Google will test more ads inside its AI answers, particularly AI Mode.
Post on X by @glenngabe
This is for Bing, but I'm still waiting to see "sponsored parts of an answer" in AIOs or AI Mode, which Google explained a while ago they wanted to test. Based on Google's Q3 earnings, I think we will see all types of ad testing going on (to increase monetization of AI Mode in particular). And of course Bing will be doing this too. Stay tuned.
Aleyda Solis, an SEO consultant and founder of the agency Orainti, blamed Google's choice of a ChatGPT-style answer page over one that sends readers on to websites, and pointed to the sites paying for it.
Post on X by @aleyda
.... or how Google tried to too little, too late, and out of fear to (badly) compete with ChatGPT using their same approach to AI answers, rather than an “open web” friendly interface (please see what Yahoo! did with Scout) and now suffers the consequence... along with millions of sites losing traffic and revenue.
What it means for software companies that buy search traffic
For a software company, the useful reading of these filings is about price and supply rather than about who is winning.
First, Google search ads are not getting cheaper. Cost per click rose from a year earlier in every quarter in the table, while paid clicks kept growing. A vendor that replaces lost organic visits with paid search is buying into a market where both volume and price are rising. That is the trade Pipedrive's CEO described: free traffic falling while the paid traffic that replaced it costs more. Alphabet's filings do not show the organic side, so they cannot say how much free traffic sites lose; they show only that Google's paid side is growing.
Second, the measure that is falling is the one that pays other websites. Google Network impressions are ads shown on publishers' pages and apps, and they have shrunk from a year earlier for three years. Software companies that sell to publishers, or that earn from display ads on content sites, are exposed to that line, not to Google Search & other.
Third, Meta's mix of rising impressions and rising prices says advertisers are paying more to reach people in feeds as well as on results pages. For a SaaS marketer, the two biggest channels are both getting more expensive per unit, and the one growing faster is the one where buyers are not typing a query. Products that people search for by category, the way buyers once searched for a CRM, carry more risk if those searches move to chatbots, as Elliott suggests, or into Google's own AI answers, the shift Solis criticizes.
Seufert's question is the one to watch in the next filings: whether ads in AI answers earn as much as the links they replace. Alphabet's paid clicks and cost per click, reported each quarter, are the first public place an answer would show.
Method
Revenue comes from the earnings releases each company filed with the SEC as Exhibit 99.1 to Form 8-K: Alphabet's for Q3 2025 to Q3 2026, and Meta's for the same quarters. Where two releases report the same quarter, the figures matched. Traffic measures come from Alphabet's 10-Q and 10-K filings from Q3 2023 to Q3 2026 and Meta's releases. Alphabet does not report Search revenue separately from other Google properties such as Gmail, Maps and Play, so the comparison uses Google Search & other as reported. Meta's advertising line covers its whole Family of Apps. Neither company reports profit by these lines, so the comparison is of revenue only. Calculations are in code and reproduce from the filings.
Questions readers ask
Is Meta's ad business now bigger than Google's?
No. Meta's $63.1 billion of Q3 advertising revenue nearly matched one Google line, Search & other. Adding YouTube ads and Google Network, Google's advertising revenue was $82.0 billion in the quarter, so Google remains the larger seller of ads by about $19 billion a quarter.
Did Google's ad impressions fall 14%?
Impressions on Google Network, the ads Google places on partner sites and apps through AdSense, AdMob and Ad Manager, fell 14% from a year earlier in Q3 2026. On Google Search & other, Alphabet reports paid clicks instead, and they rose 8%. The two figures measure different businesses.
Why are Meta's ads growing faster than Google Search?
Meta sold 10% more ad impressions at prices 14% higher in Q3 2026. Google Search & other grew 12% on 8% more paid clicks and 4% higher cost per click. Analysts quoted by CNBC tie part of the difference to people moving some searches to AI chatbots; Alphabet says its query growth is the fastest in five years.